

She Figures 2018: GE in Research Slowly Improving
The latest statistics (She Figures) on the footprint of women in the research landscape, from higher education to employment up to top positions and intellectual output across the EU countries.
Gender equality has been and remains a core value of the EU. Legislations are currently in place to promote equal pay, work-life balance, health, and remove all forms of gender-based bias. The She Figures report is funded by Horizon 2020 to monitor progress towards gender equality in research and innovation within the EU.
The report, released every 3 years, presents official statistics on women in research and provides a range of indicators on gender equality in research and innovation, including gender balance in science, as well as the relative pay, working conditions, and funding success of women and men in working in research.
The recent figures show that only one-third of researchers in the EU’s 28 member states are women, and has not changed since the 2015 report. The countries with the highest proportions of women researchers are Latvia and Lithuania (51 and 50.7 per cent, respectively). Whereas, the lowest proportion is in the Netherlands (25.4 per cent) followed by France (26.1 per cent) and the Czech Republic (26.9 per cent). Interestingly, countries that spend the most on research have the lowest proportions of female researchers.
In addition, working conditions between men and women are considerably different. For example, 13 per cent of women researchers worked part-time in 2016 compared to 8 per cent of males. Moreover, around 8 per cent of women were working under ‘precarious conditions’ (contract arrangements) compared to only 5 per cent of men in the research field.
Furthermore, a significant gender pay gap still exists. Women, on average, earned about 17 per cent less than their male counterparts in 2014. The gap has actually widened slightly in science and engineering occupations since 2013, and the gap only increases with age.
While women now outnumber men at the student and graduate levels and numbers are balanced at the PhD level, gender stereotypes still persist. This is evidenced by the low proportion of women (32 per cent at Bachelor, Master, or equivalent) in the fields of science, technology, engineering, and mathematics (STEM). The differences are perhaps most evident at the top of the academic ladder. Women remain a minority in top academic positions (15 per cent). Happily, the ratio of female to male authors is improving ― increasing by nearly 4 per cent annually since 2008.
STATISTICS SUMMARY
The EU is approaching gender balance among doctoral students. Overall, in 2016, women made up 47.9 % of doctoral graduates at the EU level, while in two thirds of EU Member States the proportion of women among doctoral graduates ranged between 45 % and 55 %.
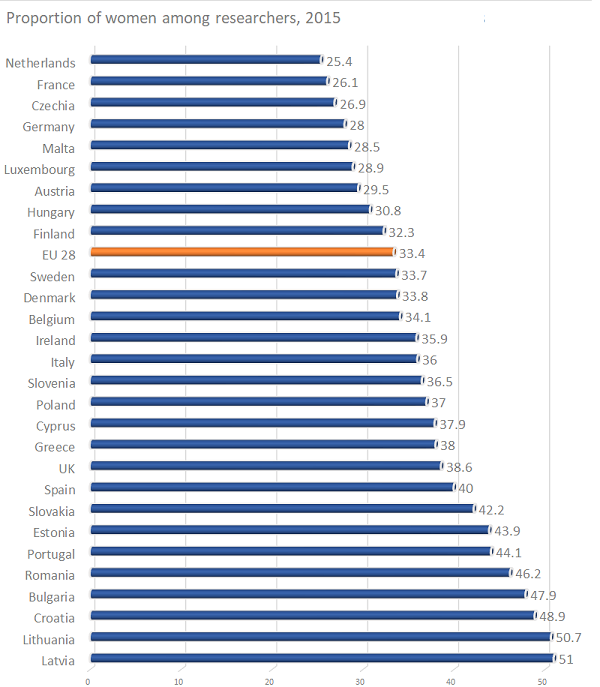
Proportion of women among researchers in 2015
While the overall number of both women and men doctoral graduates increased between 2007 and 2016, in most of the countries that She Figures covered, the number of women doctoral graduates increased at a faster rate than that for men.
The proportion of women among doctoral graduates still varies among the different fields of education; in 2016, women doctoral graduates at EU level were over-represented in education (68 %), but under-represented in the field of information and communication technologies (21 %) and the fields of engineering and manufacturing and construction (29 %).
Tertiary educated women make up a majority of ‘professionals and technicians’ in the EU-28 (Chapter 3). More specifically, in 2017 at the EU level, women represented 53.1 % of the persons with tertiary education who were employed as professionals or technicians.
In contrast, in science and engineering, women in the EU-28 were still a minority as they made up only 40.8 % of people employed as scientists or engineers. However, between 2013 and 2017, in both science and engineering and professional and technical occupations, the number of women grew on average by 2.9 % per year between 2013 and 2017.
In total employment, women continue to hold lower shares than men, and even when they have tertiary education, women are more likely than men to be unemployed.
In the EU-28 in 2017, the unemployment rate for women with tertiary education was 3.8 %, while for men the same rate was 2.9 %.
Gender imbalance amongst researchers still remains as in 2015 only one third of the EU’s researchers were women.
However, during the 2008-2015 period, the number of women researchers in the EU-28 increased at higher rate on average than men (3.8 % for women and 3.4 % for men).
Women researchers’ presence in 2015 was strongest in the government sector (where 42.5 % of researchers are women) and in the higher education sector (42.1 %) resulting in a more gender-balanced population of researchers at the EU level. On the contrary, in the business enterprise sector, women are still severely under-represented as they only represent 20.2 % of the total number of researchers.
Differences between women and men can also be observed in their working conditions as researchers (Chapter 5). At the EU level, the proportion of women researchers working part-time was higher than that of men; 13 % of women researchers and 8 % of men researchers were working part-time in 2016. Furthermore, 8.1 % of women and 5.2 % of men researchers worked under contract arrangements considered as ‘precarious employment’. In terms of equal payment, there is still a considerable gender pay gap in scientific R&D occupations.
Across the EU-28, women in R&D earned on average 17 % less than their men colleagues in 2014, and the gender pay gap was found to widen with age. Moreover, the presence of women researchers seems to have an inverse relationship with the R&D expenditure per researcher; most of the countries that spent more per researcher had some of the lowest shares of women researchers.
As they moving up the academic ladder, women are less represented (Chapter 6). In the EU-28 in 2016, women represented 48 % of doctoral students and graduates, 46 % of grade C academic positions, 40 % of grade B and 24 % of grade A academic positions. The gap between women and men was wider in STEM (science, technology, engineering and mathematics); while women made up 37 % of doctoral students and 39 % of doctoral graduates, they held only 15 % of grade A academic positions.
In the EU-28, the proportion of women among heads of institutions in the higher education sector increased from 20 % in 2014 to 22 % in 2017. Furthermore, in 2017, women made up 27 % of the members of boards of research organisations, while when focusing on board leaders alone, the 6 proportion of women decreased to 20 %.In the EU-28, women were still under-represented in the writing of scientific papers (Chapter 7).
Between 2013 and 2017, the ratio of women to men among authors of scientific publications in the EU was on average one to two. However, this ratio is slowly improving and it has been increasing by almost 4 % per year since 2008. The highest women to men ratio of authorship was observed in the fields of medical and agricultural sciences, where a little over eight women authors corresponded to 10 men authors.
Moreover, women are still strongly under-represented among patent inventors; between 2013 and 2017 in the EU, the women to men ratio of patent inventors was on average just over one to three. A strong gender gap in the composition of the inventors’ teams was also observed in the EU-28, where the most frequent composition of the teams was all men (47 %), followed by those with just one male inventor (33%). A final overall observation for EU countries was a slight gender gap in receiving research grants. The funding success rate was higher for men team leaders than women team leaders by 3.0 percentage points.
This She Figures 2018 publication includes new indicators to further assess gender inequalities. Some of these indicators provide insi ghts on the early segregation in the education pathways chosen by young women and young men and their subsequent progress to the top educational levels. Another new indicator measures the propensity of women and men to work alone, in same-sex teams or in mixed teams, as patent inventors. Finally, an indicator on the integration of a sex and gender dimension in published research has been further developed by expanding its scope to cover additional species as well as humans, and the definition of the sex and gender dimension has been revised.
xxxxxxxxxxxxxxxxxxxxxxxxxxxxxxxxxxxxxxxxxxxxxxxxxxxxxxxxxxxxxxxxxxxxxxxxxxxxxxxxxxxxxxxxxxxxxxx
Yyou can download the entire report HERE.
To read more about the Czech context of women representation in research please click HERE.
To download ACADEMICS 2018: GENDER EQUALITY RESEARCH click HERE.